Blog
Delivering measurable customer value: Sellforte Customer Happiness Survey 2023 received an NPS of 59
December 14, 2023 | Samantha Lee-Uusitupa, Carmen Bozga
At the heart of Sellforte's ethos is our unwavering commitment to providing tangible benefits to our clients. This commitment isn't just the driving force behind why customers choose our services; it's the core reason they continue to partner with us. Every member of our team, collectively known as Sellforteans, contributes significantly to this endeavor.
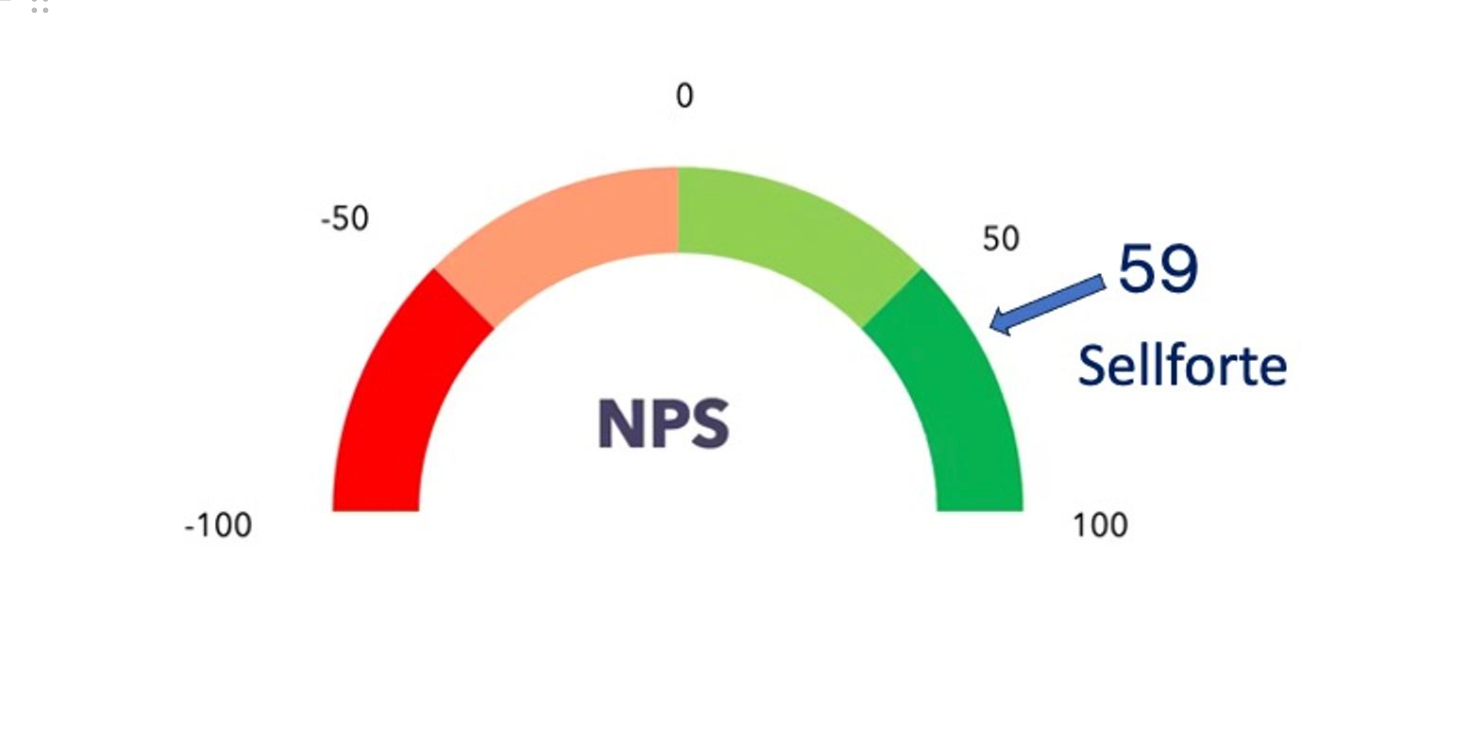
Our Net Promoter Score (NPS) stands as a proud indicator of our exceptional customer service, particularly when viewed in the context of the industry standard. The average NPS for a SaaS company hovers around 30, yet Sellforte has soared well above this benchmark, achieving an impressive 56 in 2022 and further elevating to 59 in 2023. This significant lead over the industry average is not just a mark of our consistency but also a clear sign of ongoing improvement in how we serve our customers.
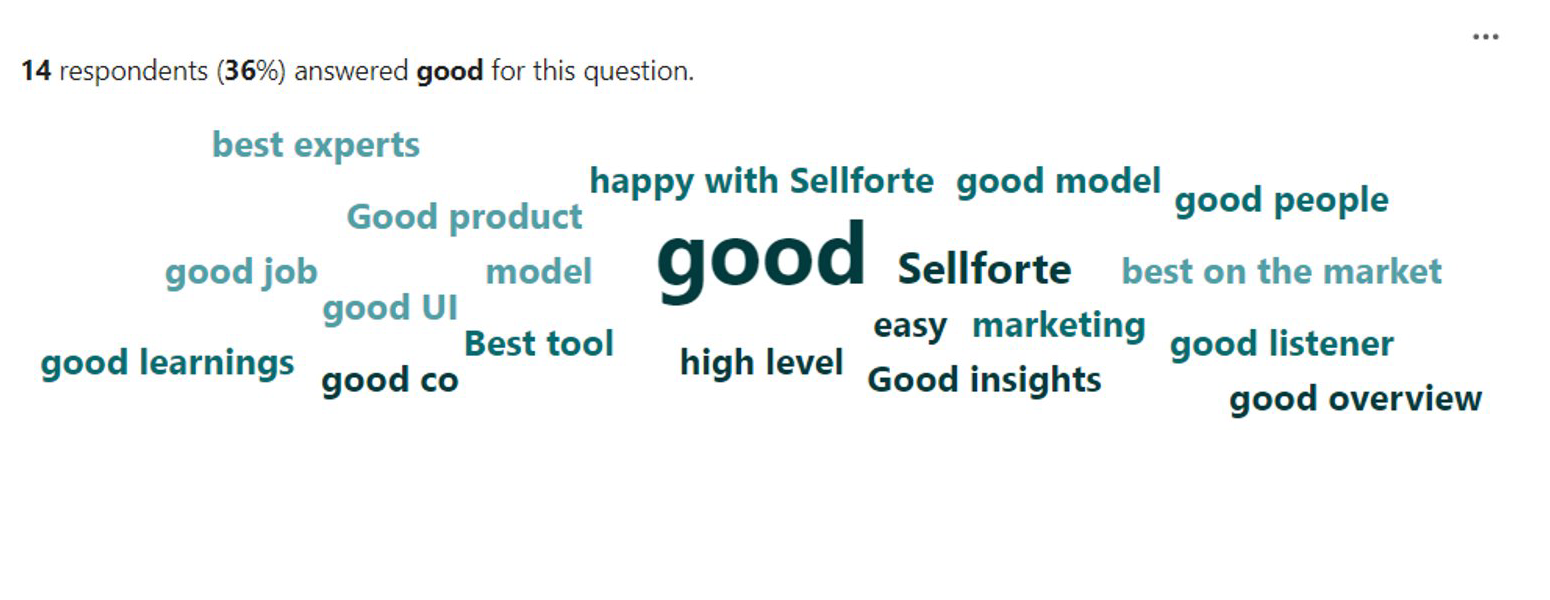
The positive feedback we've received, especially regarding the effective collaboration with our Customer Success Managers and Customer Data Scientists, underscores the value we add. This achievement is a powerful motivator for our entire customer delivery team, who remain passionately committed to helping our clients achieve their business goals, setting new standards in customer satisfaction and service excellence.
Our feedback
The feedback we gathered offers a comprehensive view of our diverse customer base, shedding light on the distinct needs across various sectors. Our survey engaged participants from a wide range of industries, enabling us to gain valuable insights into different market dynamics. The industries represented in the survey include:
- Media
- Fast-Moving Consumer Goods (FMCG)
- Other Industries
- Retail
- Telecommunications (Telco)
Furthermore, the diversity of our survey respondents is reflected in their varied job roles, encompassing a spectrum of expertise and perspectives. Participants held positions in Analytics/Customer Insights, Marketing, Sales, and Finances.
To visually represent this diversity, we have included a pie chart below. This chart clearly delineates the proportion of survey participants from each industry, offering a clear overview of the industry-specific feedback we received.
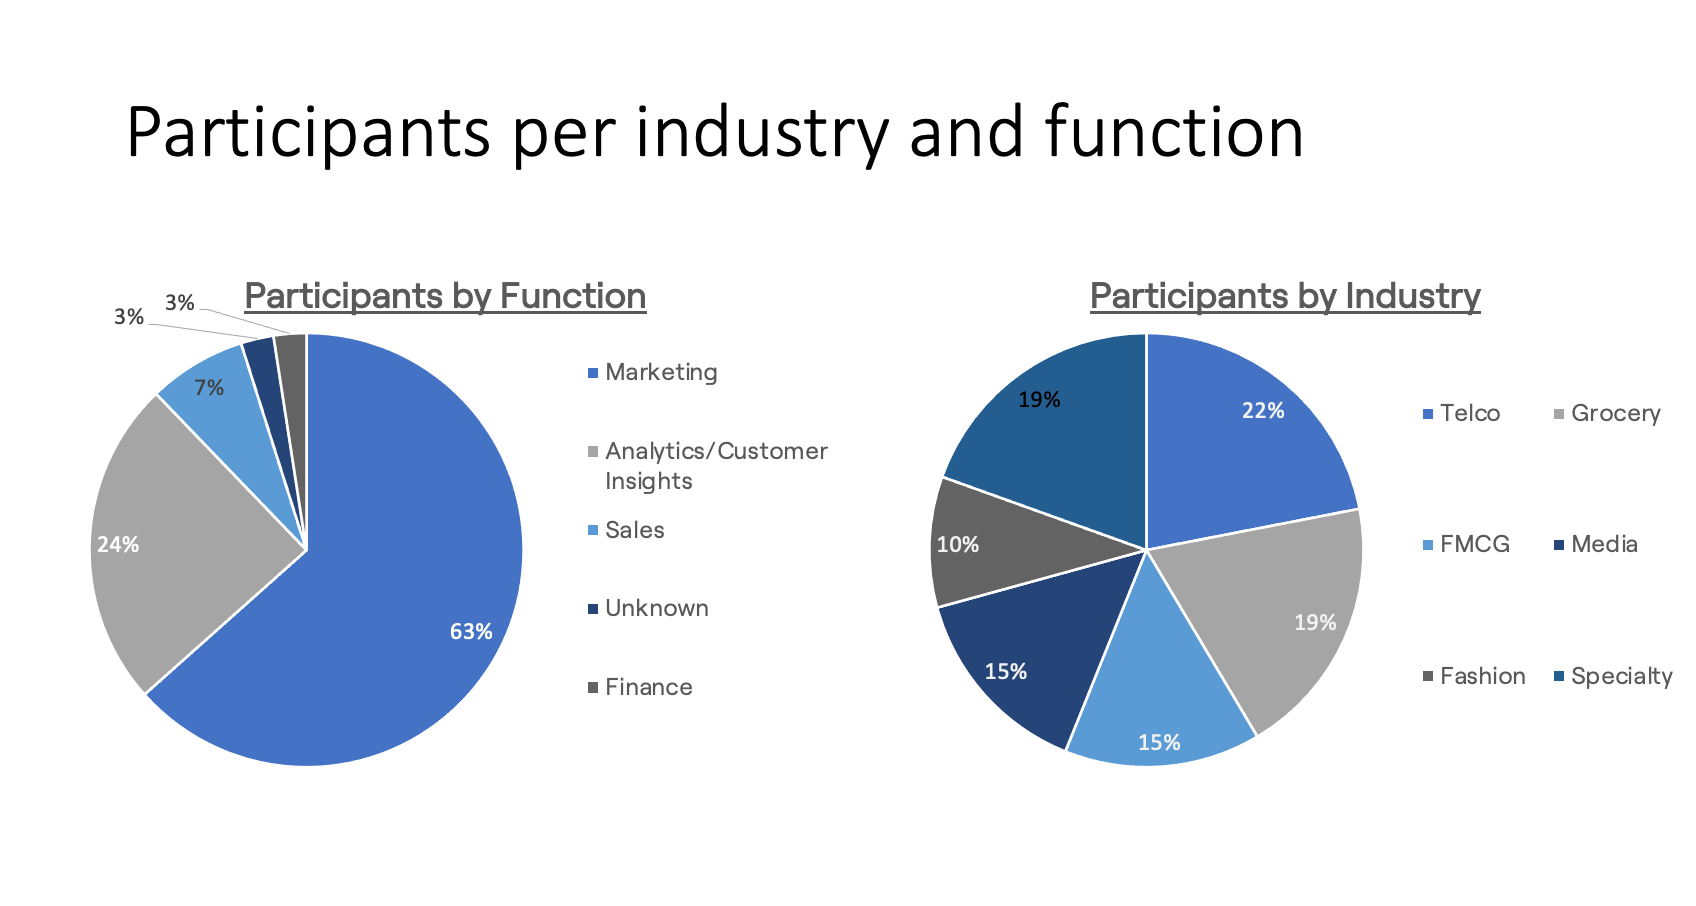
The participation trends in our NPS survey reveal insightful patterns, particularly in the context of Sellforte's core audience. It's noteworthy that individuals in marketing roles constituted the largest segment of our survey respondents. This aligns well with the focus of our Marketing Mix Modeling product, which is primarily tailored for marketing professionals.
The high engagement from marketers in our survey is a testament to our product's relevance and appeal in the marketing sector. It underscores the alignment between our product offerings and the needs of marketing professionals, indicating that we are effectively reaching and resonating with our target audience. This valuable feedback from the primary users of our services provides us with a clear direction for continued product development and enhancement, ensuring that we stay attuned to the evolving needs and preferences of marketing professionals.
The data from our survey presents a clear picture of the industry distribution among our respondents, with Retail—encompassing both grocery and fashion sectors—emerging as the predominant industry. Understanding the nuances and specific requirements of grocery and fashion retailers through this feedback is crucial. It enables us to refine our approach, enhance our offerings, and continue to develop solutions that resonate deeply with the Retail sector's unique challenges and opportunities.
The participation in our survey revealed another significant insight: the Specialty sector, which includes industries like hospitality, followed closely behind Retail (grocery and fashion) in terms of representation. This notable presence of the Specialty sector, particularly hospitality, is an important aspect of our survey's demographics. This balanced representation from both Retail and Specialty sectors offers a comprehensive perspective on the impact and effectiveness of our services across different market segments.
Survey details
The logistics and methodology of our survey provide valuable context to its results and response rates. Here's a breakdown of how the survey was conducted:
- Survey Timeline: The survey was launched on the 27th and 28th of April and remained open for two weeks, concluding on the 14th of May.
- Distribution and Reminders: Our Customer Success Managers (CSMs) played a pivotal role in distributing the survey. They personally emailed the survey link to their clients and followed up with reminders a week later to encourage participation.
- Response Rate: The survey achieved a commendable 38% response rate, indicative of strong engagement and interest from our customer base. This year the response rate was higher than last year (24%).
- Customer Reach: We targeted a specific segment of our clientele, sending the survey to 107 customers. Out of these, we received 41 responses, which provides a solid sample size for meaningful insights.
- Incentives for Participation: To encourage participation, we offered gift cards from Verkkokauppa and Fazer. This incentive likely contributed to the healthy response rate.
- Mandatory Information: We required participants to provide their company information to ensure relevant and targeted feedback. However, providing a personal email address was optional unless the participant was interested in receiving a gift card. This approach balanced the need for useful data with respect for individual privacy and preferences.
What is NPS?
NPS is a widely recognized metric used to assess customer loyalty and satisfaction. It provides a straightforward yet effective way to gauge how customers feel about a company's products or services.
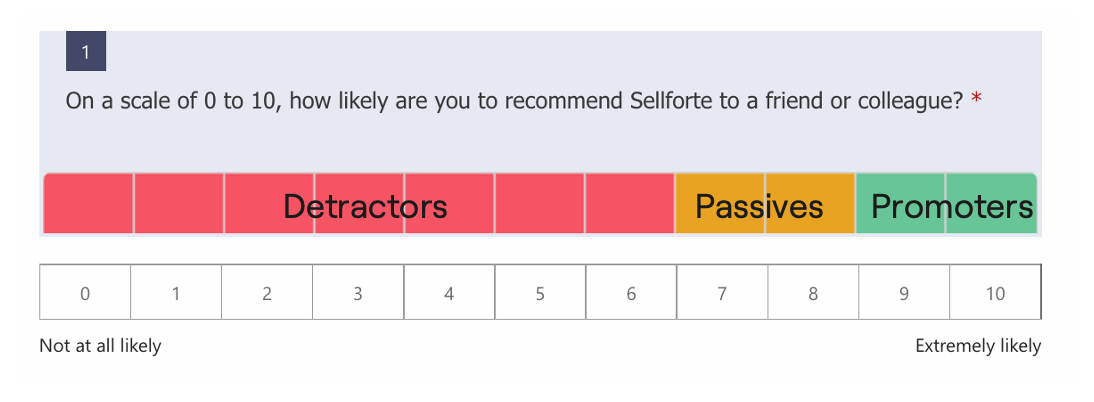
NPS is a measure of customer satisfaction and loyalty, determined by asking customers how likely they are to recommend a company's product or service to others. It operates on the principle that customers who are loyal and satisfied are more inclined to endorse a product or service. The NPS scale ranges from -100 to +100, where higher scores indicate greater customer satisfaction and loyalty.

To calculate the NPS, a systematic approach is followed, beginning with gathering customer ratings. Customers are surveyed to rate, on a scale of 0 to 10, their likelihood of recommending the company's product or service. These responses are then categorized into three groups: Promoters, who score 9-10 and are highly satisfied and likely to recommend the product or service; Passives, scoring 7-8, who are satisfied but not enthusiastically so, and may be swayed by competitors; and Detractors, scoring 0-6, who are dissatisfied and unlikely to recommend the product or service, and might even discourage others from using it. The final NPS is calculated by subtracting the percentage of Detractors from the percentage of Promoters. For example, if a survey reveals 50% Promoters, 20% Passives, and 30% Detractors, the NPS would be 20, calculated as 50% (Promoters) minus 30% (Detractors).
Going forward
The feedback we received from our customers has been invaluable in shaping our future actions and priorities. A key aspect of this feedback was the desire for a deeper understanding of our model. In response, our Customer Success Managers (CSMs) have taken proactive steps to guide our customers towards the extensive resources we offer on Marketing Mix Modeling (MMM). This includes directing them to our informative blog and the comprehensive Sellforte Academy, both of which are rich sources of knowledge and insights about MMM and its applications.
Additionally, we have paid close attention to several product feature requests suggested by our clients. Recognizing the importance of these suggestions, we have not only explored these ideas but also escalated them higher up our priority list. This action reflects our commitment to continually evolving our offerings in line with the needs and expectations of our customers. By taking these steps, we aim to not only enhance the user experience but also ensure that our solutions remain at the forefront of innovation and effectiveness in the industry.
We started this year's customer survey round with a realistic mindset, anticipating that we might not attain scores as high as last year's. However not only did we reach the same high level, but we passed it by 3 precious points! Each point gained is a testament to our passion and teamwork, proving that our collective efforts make a lasting impact. We will certainly savor this success and channel the positive energy into continued growth and innovation. Onward and forward to Sellforte!
Conclusion
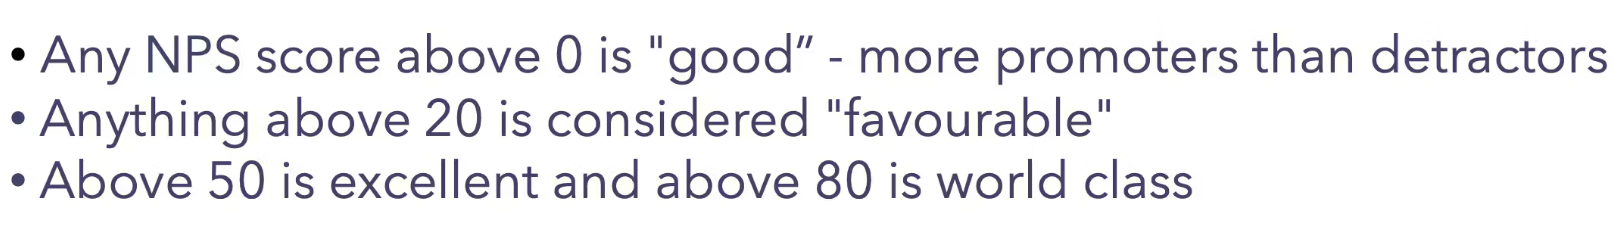
In conclusion, Sellforte's achievement of a Net Promoter Score of 59% in 2023 is a significant milestone, especially when compared to the industry average for SaaS companies, which typically ranges between 30 to 36. This exceptional score, up from 56% in the previous year, not only places us well above the industry standard but also firmly in the "excellent" category of customer satisfaction.
It stands as a clear testament to our unwavering commitment to delivering outstanding value and service to our clients. This accomplishment reflects our understanding of and responsiveness to our customers' needs, reinforcing our position as a leader in customer satisfaction within the competitive SaaS landscape. It underscores the strong loyalty and advocacy of our customer base, paving the way for continued growth and success in the years to come.
Here you can read about our Customer Happiness Survey 2022.
Curious to learn more? Book a demo.
Related articles
Read more postsNo items found!