Blog
What data do I need for Marketing Mix Modeling?
May 14, 2021 | Chris Kervinen

What data do I need for MMM and where to get it from?
Neil Borden has been identified as one the first persons to use the term marketing mix in his famous phrase from 1949: “An executive is a mixer of ingredients, who sometimes follows a recipe as he goes along, sometimes adapts a recipe to the ingredients immediately available, and sometimes experiments with or invents ingredients no one else has tried." The mix (which consisted of 4Ps at first, then 7Ps, and eventually 7Cs) has been somewhat clear for the marketers throughout the years, the modeling on the other hand not so much. We’ve previously covered what is Marketing Mix Modeling and what ROMI stands for , but in this article we’re diving into the ingredients – data inputs – you need for Marketing Mix Modeling.
Sales / Transaction data
You start the process a bit surprisingly with the outcomes – sales and profit time series data. The more ambitious you are with your modeling process, the more granular data you want to gather. Day-city-Stock Keep Unit (SKU) level data will be sufficient for most cases, as the model can build comprehensive overview of how each product’s sales develop over time and in different regions:
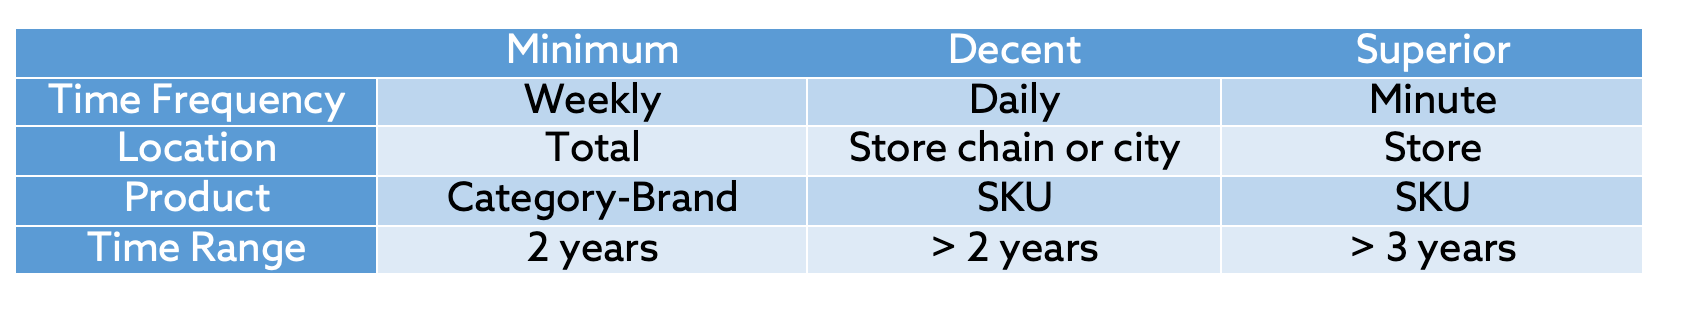
Why do you need this data? Item-location-day level sales data enables the model to plot when and where sales have happened on granular level enough for linking the changes with Marketing & External Data inputs.
Where do you get this data? Obtainable from your company’s ERP, Data warehouse or CRM.
Is it really necessary to have data from at least the past 2 years? More or less, yes. Having at least two years of historical data brings a host of benefits. Your analysis will be able to model the seasonal effects better and the data will have greater number of different combinations of e.g. different marketing activities. This will help you get better results in the end.
Extra notes: You should automate the sales data pulls as much as possible to ensure consistent data formats.
With the sales data, you should aim to include information about different promotions/discounts as well. This will help you to recognize price-sensitive product categories and apply Promotion Effectiveness Analysis , if you like. More importantly, the modeling delivers far more accurate and reliable results when attribute part of the sales and profit uplift to promotions.
How do I include/mark promotion data? Sometimes you have the promotions flagged on the receipt level data and it is straightforward to include them in your analysis. Other times you might have a separate system (e.g. Relex) for managing your promotions per SKU-location combination on a Start Date – End Date basis and you can join this information to the sales data. If neither of these is the case for you, you can still get insights by using the price information to calculate discounts and utilize them in your modelling.
And that’s it from the outcome-side! Once we’re done with the base, it’s time to move on the filling: Marketing Communications data.
(Tactical) Marketing Communications data
Once you got your cake base (sales and profit graphs) in the oven it’s time to work on the filling. This will certainly be the most laborious part of the extraction process as the data is in most cases scattered across different places. But as in baking, the more you model the faster and better you can do it each time. The learning curve isn’t as steep and high as most imagine it to be, so being tenacious and committing related actors for agreed data formats & deliveries will make you a true marketing scientist in no time!
The filling ingredient a.k.a. marketing communications data required for the MMM consist of 3 or 4 groups, depending on your industry:
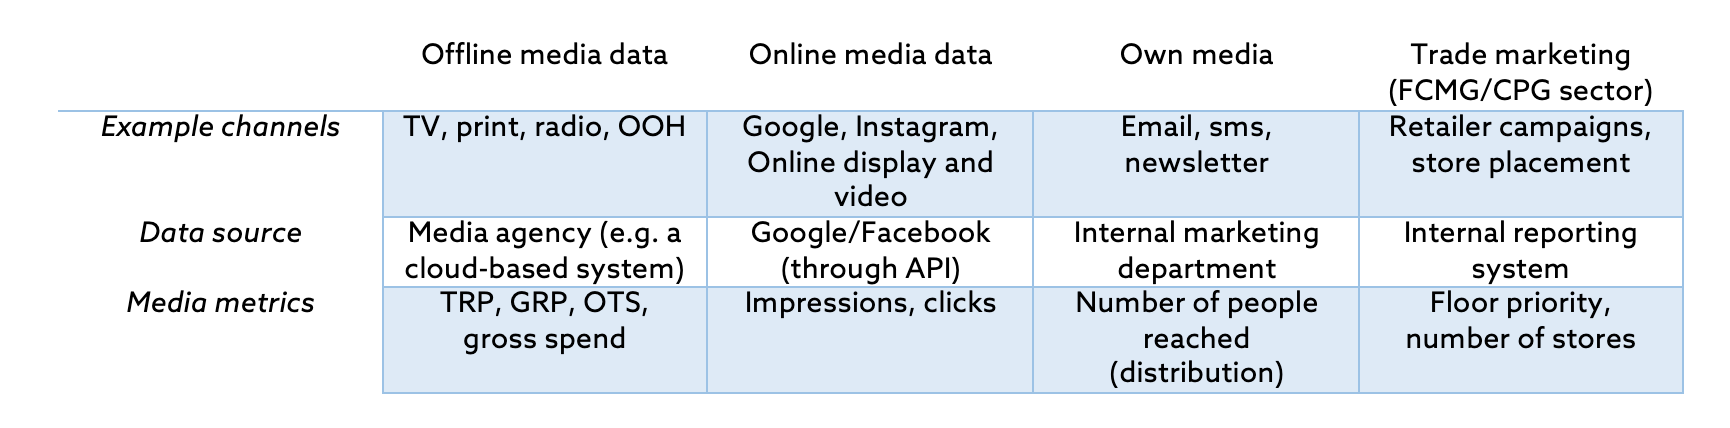
The media metrics may vary a bit based on what kind of approach and model you’re using. The gross media investments are often enough to calculate the Return on Marketing Investment (ROMI), but you should have additional indicators (TRP, OTS, Impressions etc.) for each media channel to increase the granularity of the source data and better separate the impact of each media.
Lastly, you need to know what, where and when specific items/messages have been advertised to dive deeper into the media effectiveness. You can categorize the media content by brands, product groups, messages (especially with brand campaigns), and if you’re really ambitious, by individual products/SKUs:
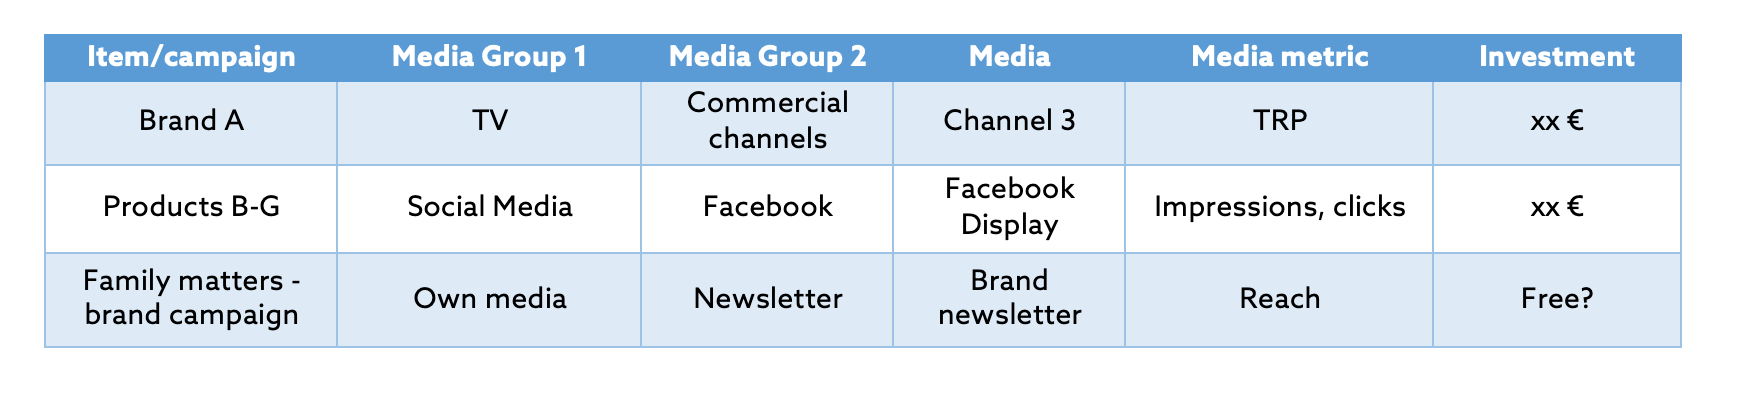
Why do you need this detailed data? Categorizing the campaigns and media investments helps gaining more insights based on the analysis.
Where do you get this data? The answer depends on the amount of media channels and whether you’re cooperating with a media agency. As a rule of thumb:
· Online media data can be pulled with APIs
· Offline media data comes from media agency. If you’re not using an agency, the media seller should be able to provide the metrics or you already have them in in-houses systems or Excels
· Own media and trade marketing data metrics come from internal systems
External data sources
The third dataset is actually an optional one. It’s the secret ingredient. Like in all masterpieces, your cake (read: model) needs something that makes the other ingredients pop. The trick is, nobody else knows better than you what this secret ingredient might be: It’s something that characterizes your industry, something that affects the demand, the customers, and the impact marketing has on both of these. Here’s some of the previous seasons’ fan favorites:
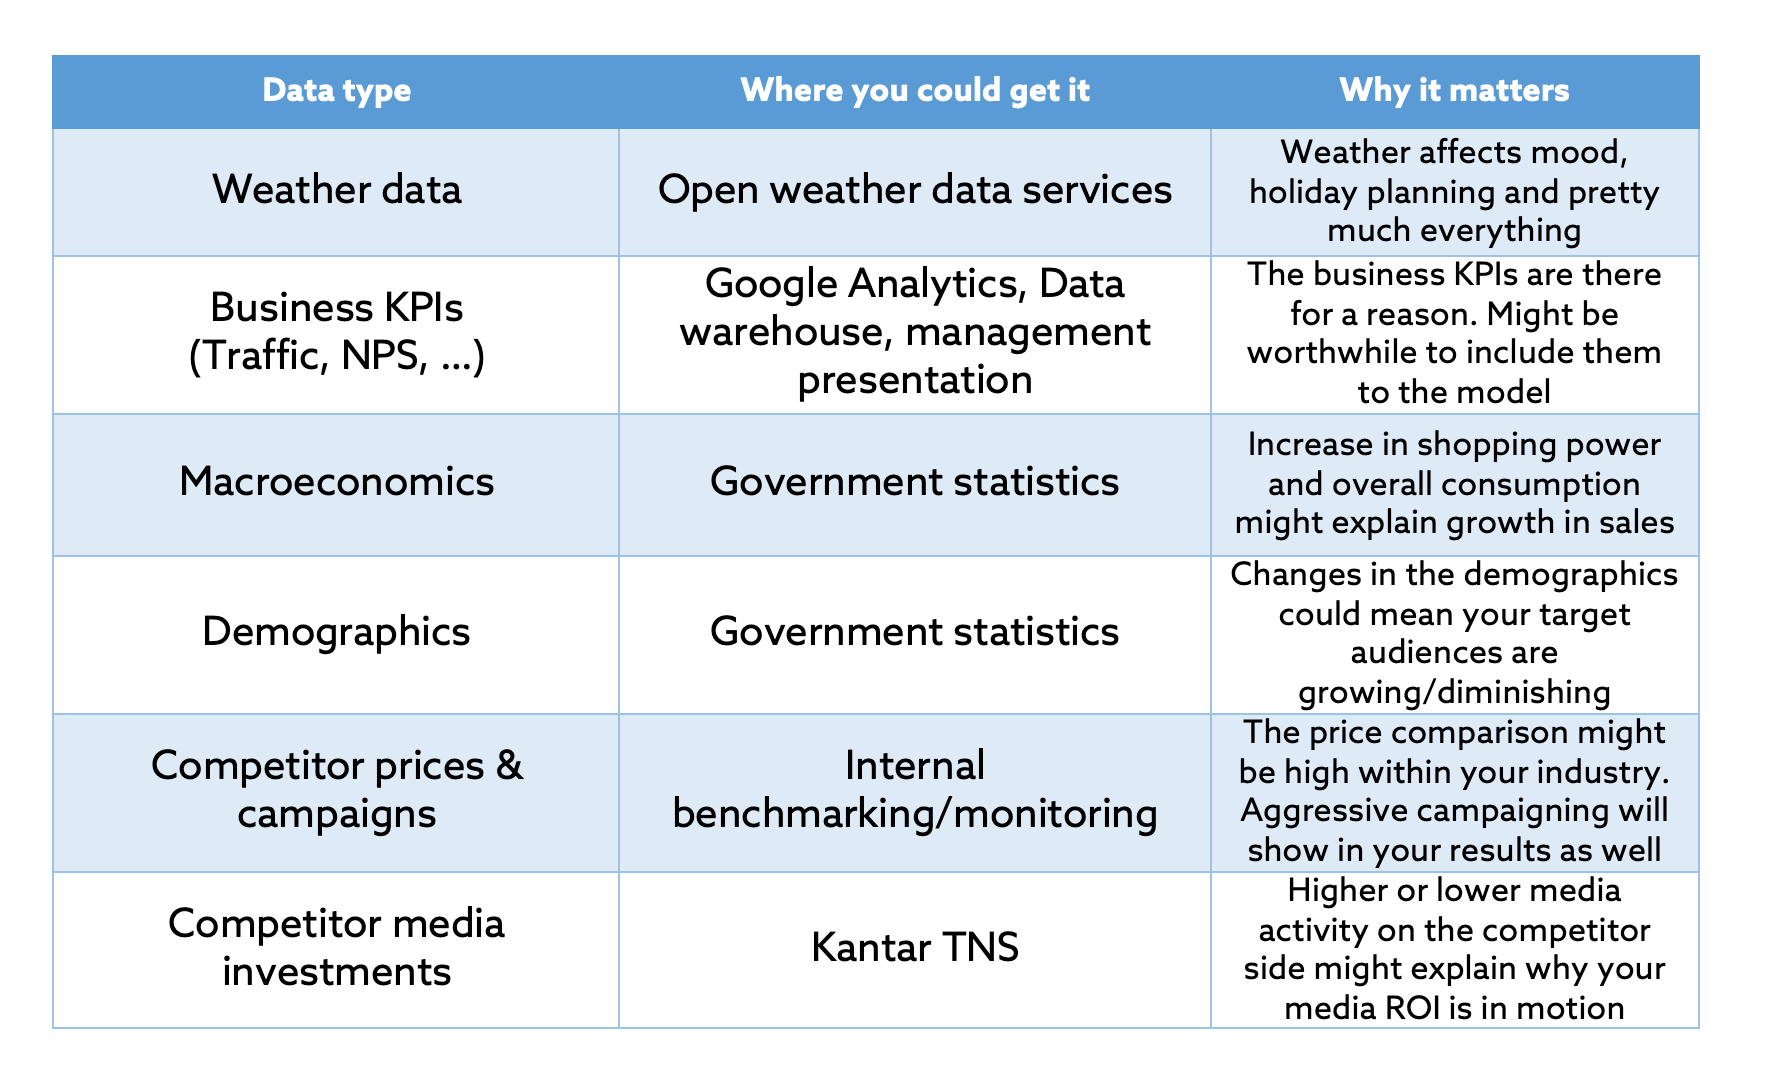
Are external data sources really necessary? No. As explained in the beginning, they’re there to complement the results’ reliability. Without them, too much uplift might be attributed to media investments and promotions. With them, you’re able to tell whether the last sales budget was missed due to suboptimal media mix or just bad weather. The external data can add a strategic viewpoint to your analysis, even if they are not used in the modelling itself.
How many external data sources do I need? Once again, none is required, but a few may enhance the modeling results’ accuracy and reliability. Remember that modesty is a virtue, and too many variables will cause the model to overfit . For example, if your model already implements yearly seasonality (e.g. ice cream sales on Summer), one needs to be smart about using the weather as an explanatory variable.
How do I input these into my model? To be honest, this depends a lot on the model. Just make sure that you have a way of connecting the different datasets (sales data, marketing data, external data). For example, time series models often take one datapoint per date, while dependent (sales) and independent variables (promotions, marketing, external) are included as columns.
And that’s basically it – you’ve successfully gathered all the required ingredients for your next masterpiece! It’s time to kickstart your modeling machines and start getting valuable insights about your commercial performance.
Curious to learn more? Book a demo.
Related articles
Read more postsNo items found!